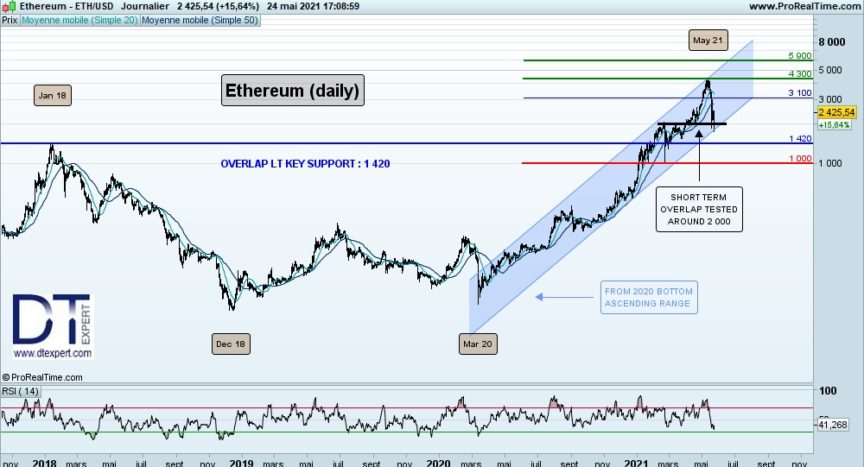
Two weeks from now, crypto-currency market faced a huge drop that seems to worry most of the crypto-traders. The two major pairs, BTC/USD and ETH/USD reached indeed new ATH (All Time Highs) around mid-May, before starting a more violent than usual, and quite unexpected, correction. Thus, Ethereum went as far as losing more than 60% before initiating a rebound on a key support zone, corresponding to both a short-term overlap (in black above) and the lower bound of the medium-term channel in place since the famous March 2020 bottom.
The question now on everyone’s lips is whether this sharp drop is another opportunity to find good entry points, or the beginning of a mini-crash much feared by the entire community?
While we do not have the means to give a definitive answer to this delicate question, we can make a technical hypothesis that will be worth what it is worth: namely, that the current rebound could lead to a recovery, provided it does not falter.
Also, as long as the ETH does not fall back clearly below the $2,000 threshold, a recovery could be taking place towards the objectives located at $4,300, and then up to $5,900 in extension, levels corresponding respectively to the peak of last mid-May, and then to the projection on the upper limit of the ascending channel. However, this scenario needs to be confirmed by breaking through the intermediate resistance of $3,100 (Fibonacci retracement of the last downwave).
Alternatively, a clear break of the $2,000 threshold combined with a bearish exit from the channel would imply an inevitable test of the key long-term overlap support around $1,420. Below this level, however, a trend reversal will be feared on the longer term, and the first psychological support of the $1,000 level will not be able to do much against this reversal.